Rotterdam has pumping stations in more than 40 districts. So monitoring and optimising these pumping stations is quite a challenging job. Wouldn’t it be great if the measurements could be taken and registered automatically? Well, the good news is that this is now possible. Thanks to ProInf: the new KPI dashboard that we developed specifically for the Municipality of Rotterdam.
What is ProInf?
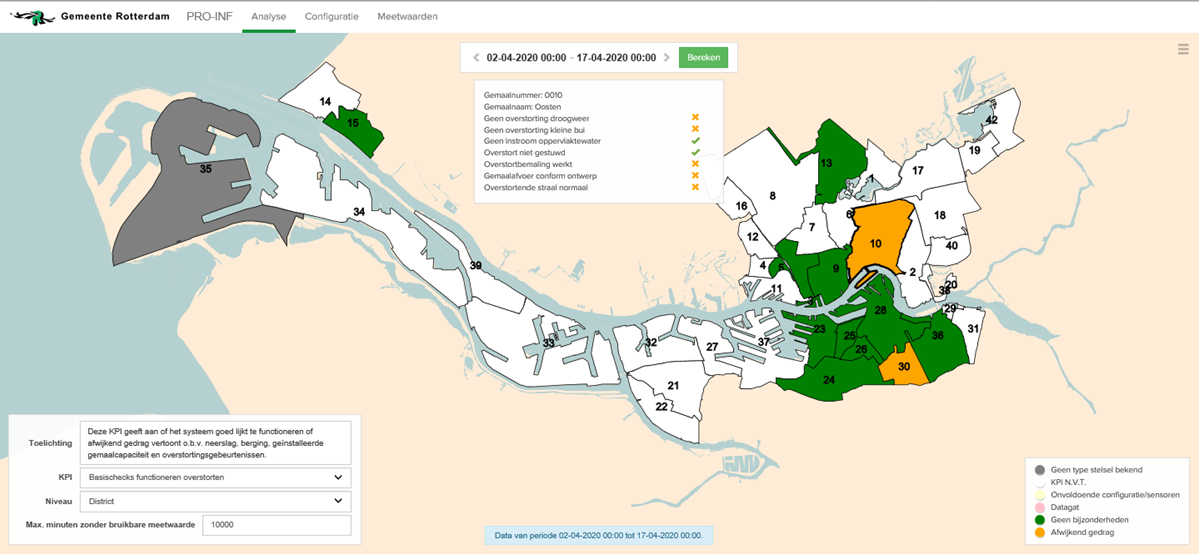
ProInf is a brand-new web application with an ingenious KPI dashboard. This dashboard allows the municipality of Rotterdam to monitor the performance of their pumping stations. The data is retrieved fully automatically from the control systems at the pumping stations. This system gives the municipality’s experts easy and convenient access to relevant statistics. Based on those statistics, they can perform analyses and determine what optimisation steps are needed. Handy, right?
How does a KPI dashboard work?
At what points do you want to visualize measurement results? That’s up toyou on the basis of the available KPI’s. You cando this based on realtime information and even based on data from, say, ten years ago. In this way employees of the municipality of Rotterdam can see at a glance whether the pumping stations are working properly, or whether there is a data gap what the flow rate is, and so on. In short: it’s all about data-drivenworking.
What are the benefits of a KPI dashboard?
A KPI dashboard like ProInf is not just extremely clear and user-friendly; it offers many other benefits:
- Within the dashboard, different rights can be assigned based on the different roles within the municipality. This ensures that both operators and analysts see the measurement values they need on their screens.
- Because the KPI dashboard provides real-time information, you can respond immediately if processes are not running properly. Moreover, the information is completely reliable because the data comes directly from the pumping stations.
- You can export all measurement values as a data set for further calculations and analyses in Excel.
ProInf itself performs all kinds of basic calculations to ensure the reliability of the data. After all, collecting incorrect data is even worse than having no data. In close consultation with the Municipality of Rotterdam, we determined which basic calculations were essential. After all, they are the best people to judge when their systems are working optimally.
You also have complete control over how the data is presented. Do you want it animated in 3D, or do you perhaps want a presentation in augmented reality? Or do you prefer to stick to graphs and bar charts? It’s entirely up to you. The Municipality of Rotterdam decided to go for a graphic display on a map.
Last but not least, you can work extremely efficiently because you only work with encrypted configuration data and reliable system measurements.
Our project with the Municipality of Rotterdam has resulted in a fully functional dynamic dashboard. Perhaps you would like to go a step further? By adding artificial intelligence, for example? We would accept that challenge without any reservations. Because we know how to train a model based on historical data. That allows us to address anomalies in the data. In addition, we are also able to recognise patterns in the data. Extremely interesting if you want to know in advance when a particular component needs maintenance.
All the data for the Municipality of Rotterdam’s ProInf dashboard comes from one large data source. Very convenient, of course, but we see no problems with using multiple data sources. Gathering the data from various sources and compiling it into a data lake and data warehouse is something we can do in our sleep. Now that we got that out of the way, what else do you need?
Interested in a meeting? We'll be happy to oblige!
Are you looking for software or hardware specialists? Or a consultant who takes the time to help you get to the bottom of your issues? We would love to hear your story! Simply contact us for a productive meeting over coffee.

